Best of both worlds
Unreal Engine 5 cinematics meets Home Assistant device ecosystem
The app is built using Unreal Engine 5 technology, which makes it possible to create a visually appealing and interactive user interface with true cinematic look and feel. Combining the power of Unreal Engine with the extensive device ecosystem of Home Assistant, Sepiana offers a unique experience that goes beyond traditional webapp dashboards. Sepiana experience is not a replacement for real dashboards but rather an alternative visualisation emphasising aesthetics and storytelling. It is designed to showcase Home Assistant data in a visually engaging way, similar to how photo modes in games allow players to capture stunning in-game moments.
New data sources may be added in the future to expand beyond Home Assistant. Feel free to suggest other data sources you would like to see supported.1
Data is beautiful
The visual concept has following configuration options:
- Scene: A static or animated 3D environment where all the dashboards are placed. The scene can be a simple room, a car dashboard, or any other environment that fits the theme. These scenes are premade and can be selected in the Sepiana JSON configuration file based on the available list of scenes. The purpose of the scene is to provide a background and lighting for the dashoard elements.
- Dashboard: Think a dashboard as a canvas where you can place and paint your dials and gauges. The dashboard can be a simple layout with few elements (gauges) or a complex arrangement with many elements. The dashboards may be available in various sizes, but always at minimum of 500mm x 500mm. Canvas is always 50mm thick allowing 40mm recession for the elements supporting such option. The available dashboards and their sizes depends on the scene design.
- Data visualisation element: A single gauge, or switch that displays a specific data point from Home Assistant. The visualisation elements can be customised with different styles, colors, and materials.
- Dial: A visualisation element for gauges that displays a single data point in a circular format, with a needle or pointer that moves to indicate the value. Dials are a bitmap image fully customizable by the user, so you can create your own dials and gauges using any image editing software.
- Camera : A camera that captures the scene and dashboard from any angle and distance. The camera can be moved and rotated to create different views of the dashboard. Camera focal length can be changed live in the range of 35mm to 300mm to capture scene in different perspectives.
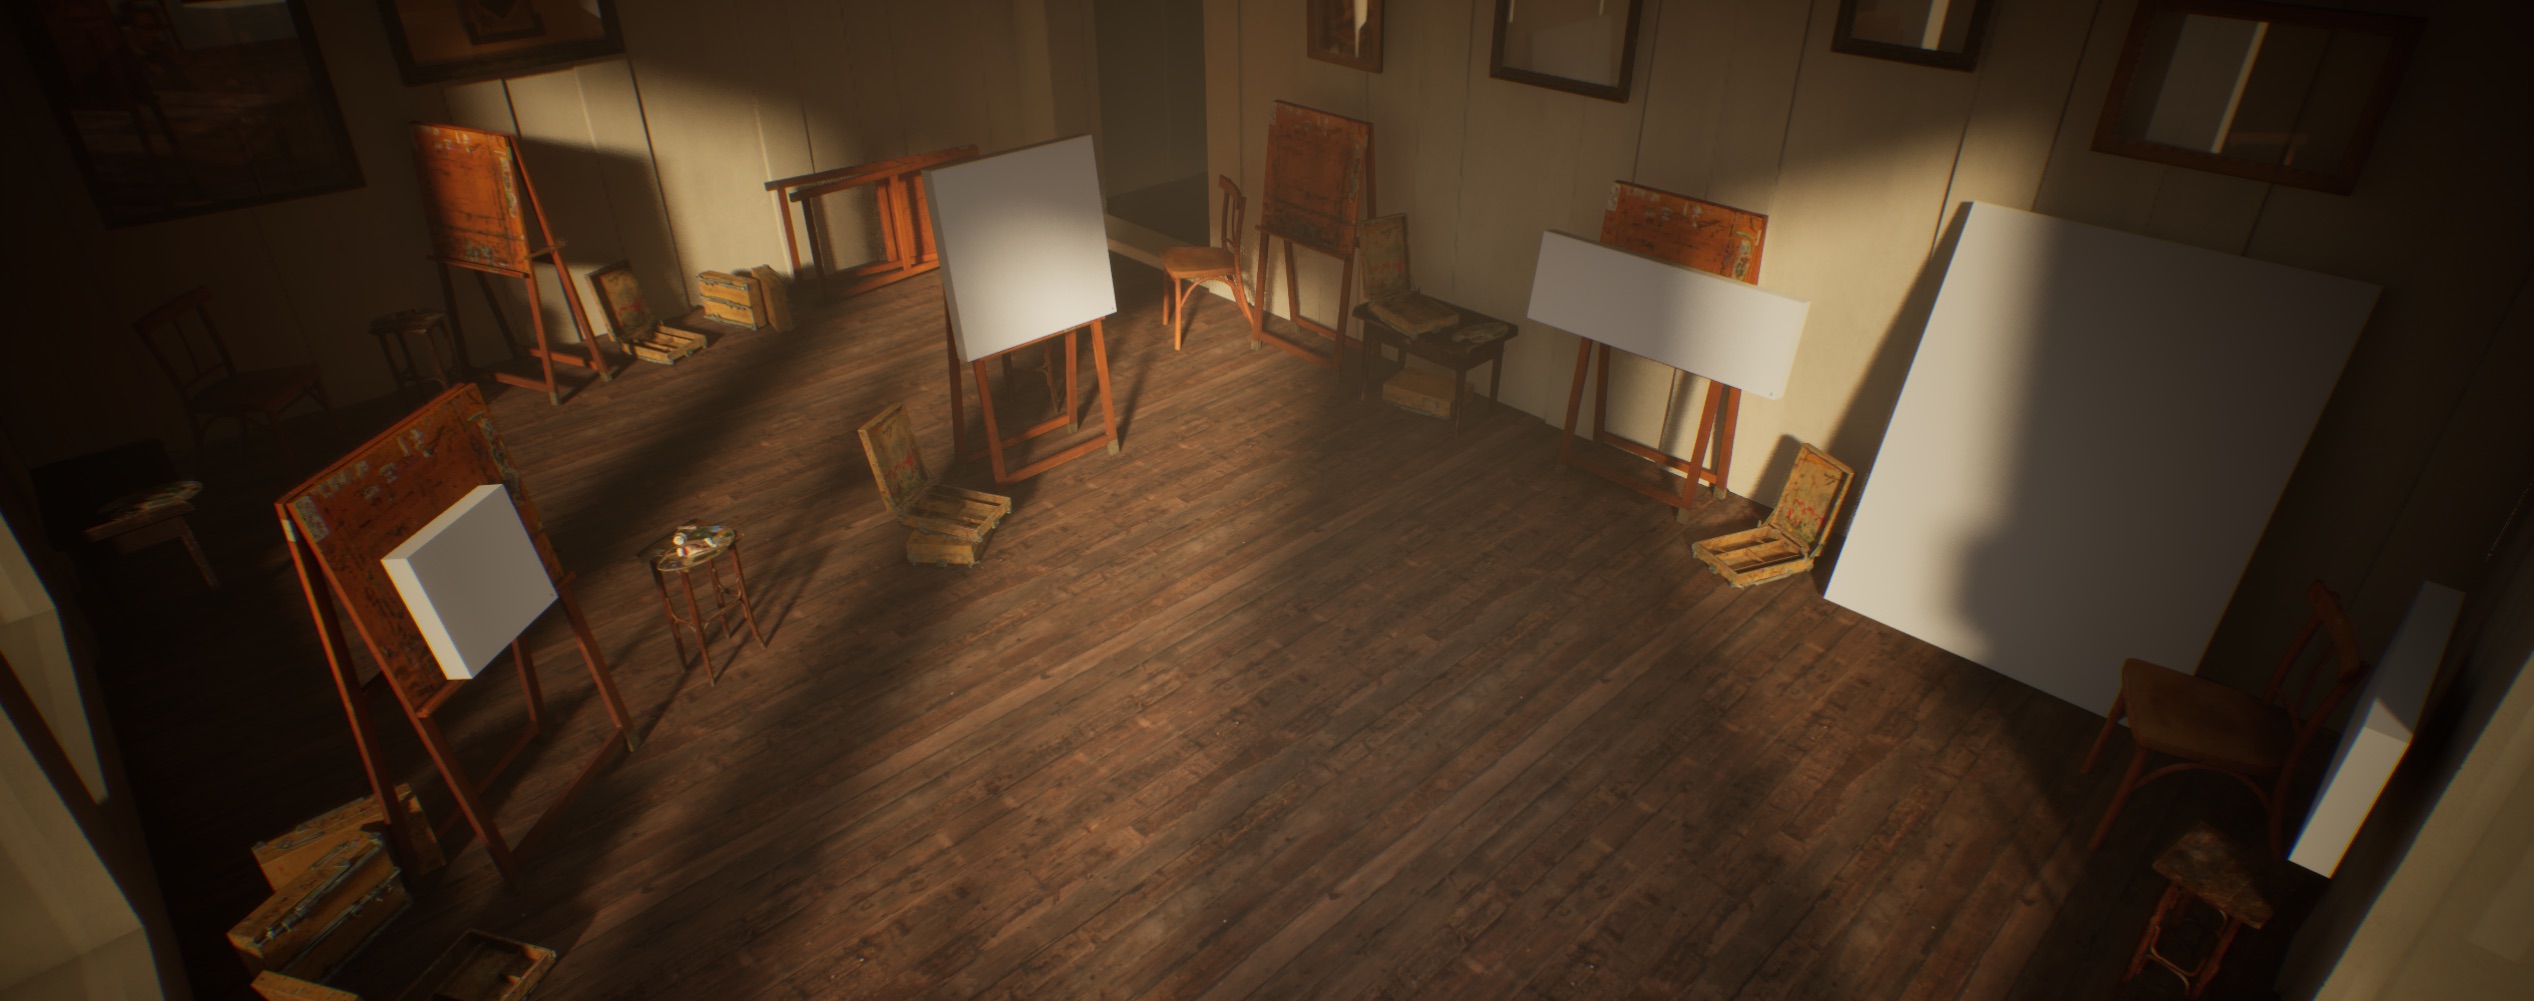
'Atelier' empty scene
A demo environment for four different dashboard/canvases. From left; s-square, m-square, s-landscape, l-portrait
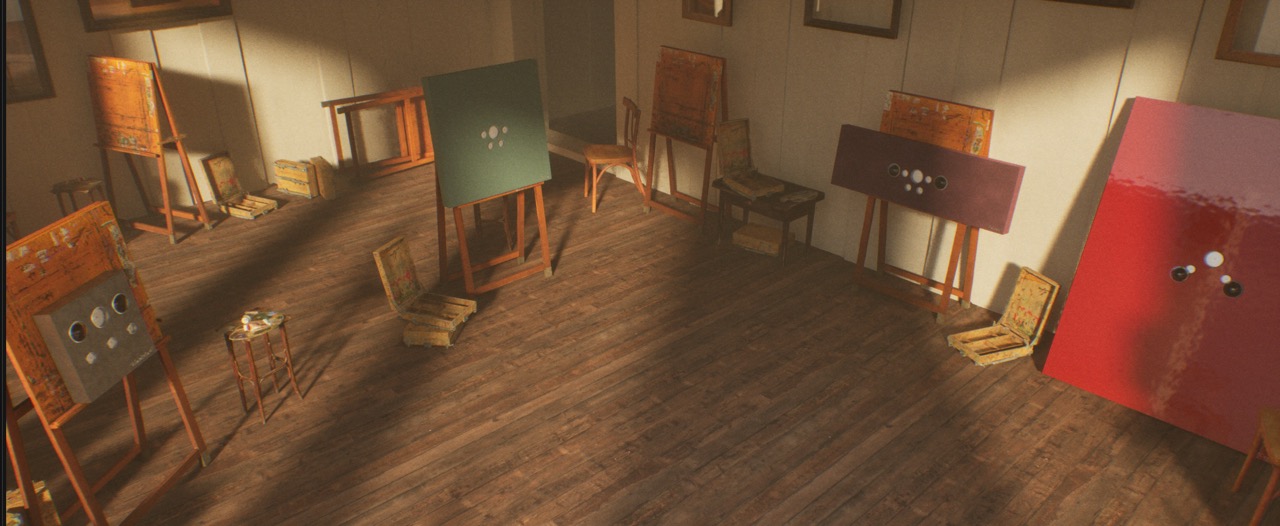
'Atelier' configured scene
The dashboard coordinate system is centered, so adding gauges will always show them center on the canvas regardless of the actual canvas size.
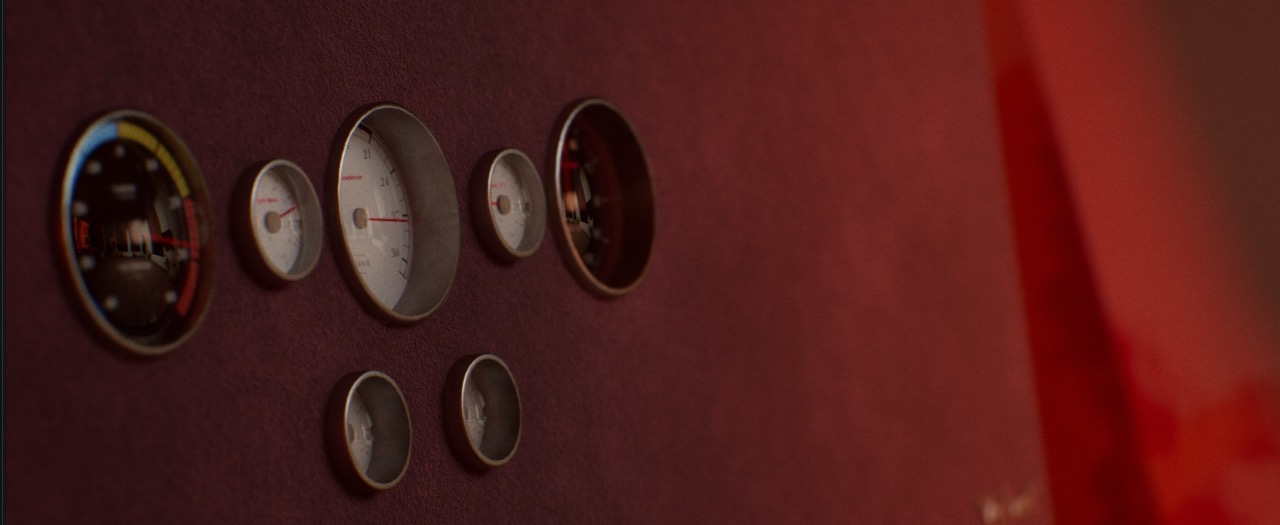
'Atelier' camera
Camera can be freely moved within the scene creating interesting perspectives for photos or live real-time data demonstrations
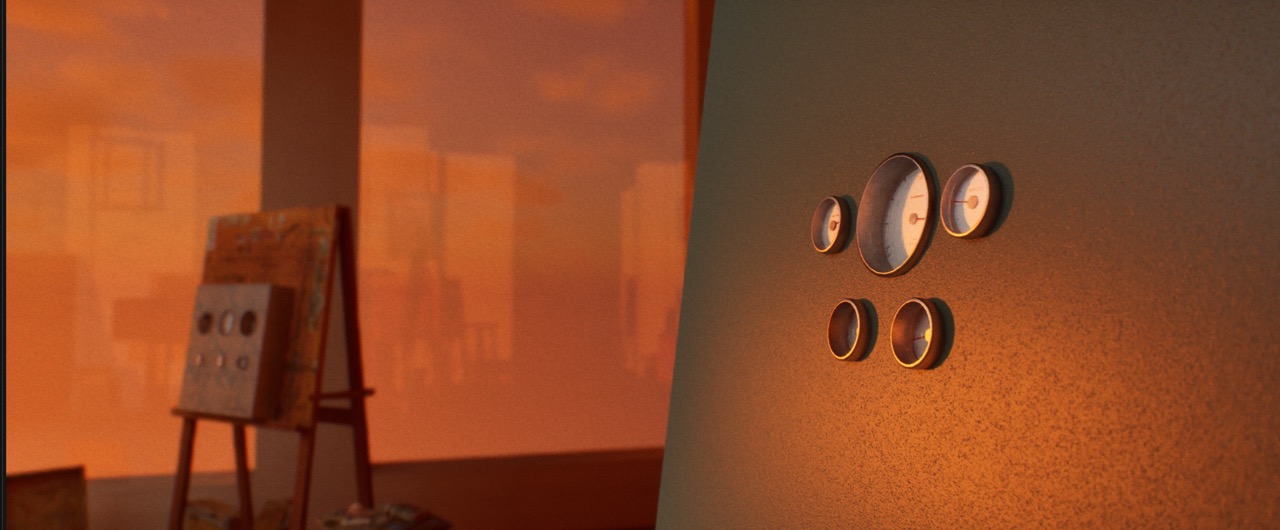
Change the time of the day
If you have trouble finding the perfect shot, changing the lightning conditions may help a find that missing edge.
Artistic touch
Gauge dial is a bitmap image fully customisable by the user, so you can create your own dials and gauges using any image editing software (vector editing software preferred). The dial can be designed to display values in degrees, percentages, or any other format that suits your needs - as long as you are able to map the incoming data values to a linear range.

from degrees

to values
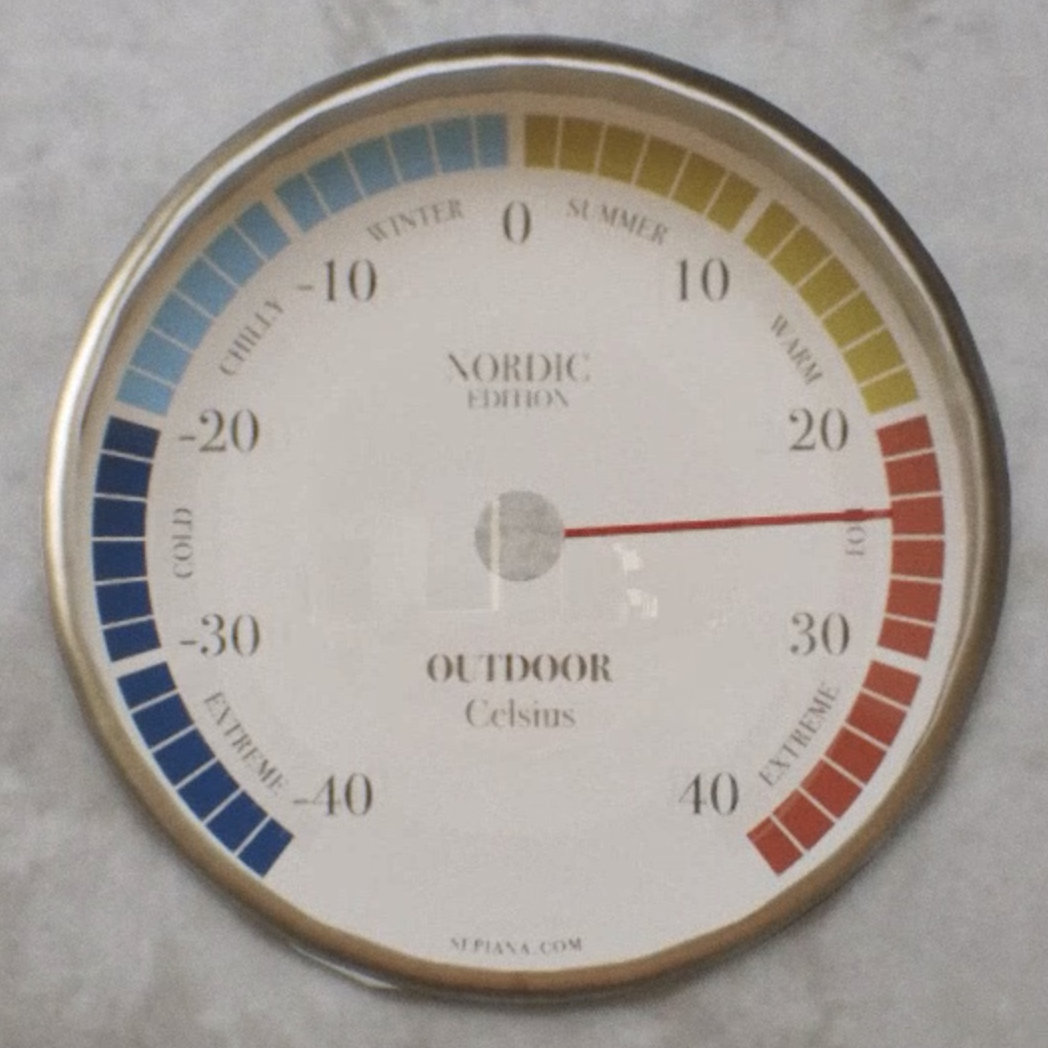
to visuals
The application is kept as a standalone desktop application to limit the need for hosted services and other paid infrastructure. This way, the app will be free to use and will not have any ads or subscriptions. Creating a product offers an excellent opportunity to learn about product management and marketing, allowing members to contribute to their own areas of interest - while using the same data and home automation setup we rely on in daily life.
-
The data source must be able to provide real-time data (e.g., over websocket, MQTT, or similar protocols). It must have authentication and authorization mechanisms to ensure that only authorized users can access the data. The data source must provide at least a device identifier and measurement value. See the configuration guide for more information on how connectivity options could be added to the Sepiana JSON. ↩︎